Replacing Laptop Thermal Paste
and plotting cpu temperature before and after the procedure

My Lenovo Thinkpad T450s was experiencing high temperatures for quite a while so I finally decided to re-apply the thermal paste.
Choosing a thermal paste
I checked reviews for different brands. The important thing to consider is to use an electrically non-conductive paste so if the paste spills over the CPU die, it wouldn’t short-circuit any IC pins. Apparently one should also mind the production date. Based on what was available and price, I chose DeepCool Z5.
Applying the thermal paste
So I opened YouTube and watched a couple of videos for this procedure for my model of laptop.
An interesting question that rises here is the geometry of the applied paste. This video did a comparison and found out there is no practical difference between different geometries.
Here is the state of things once I opened up the heatsink
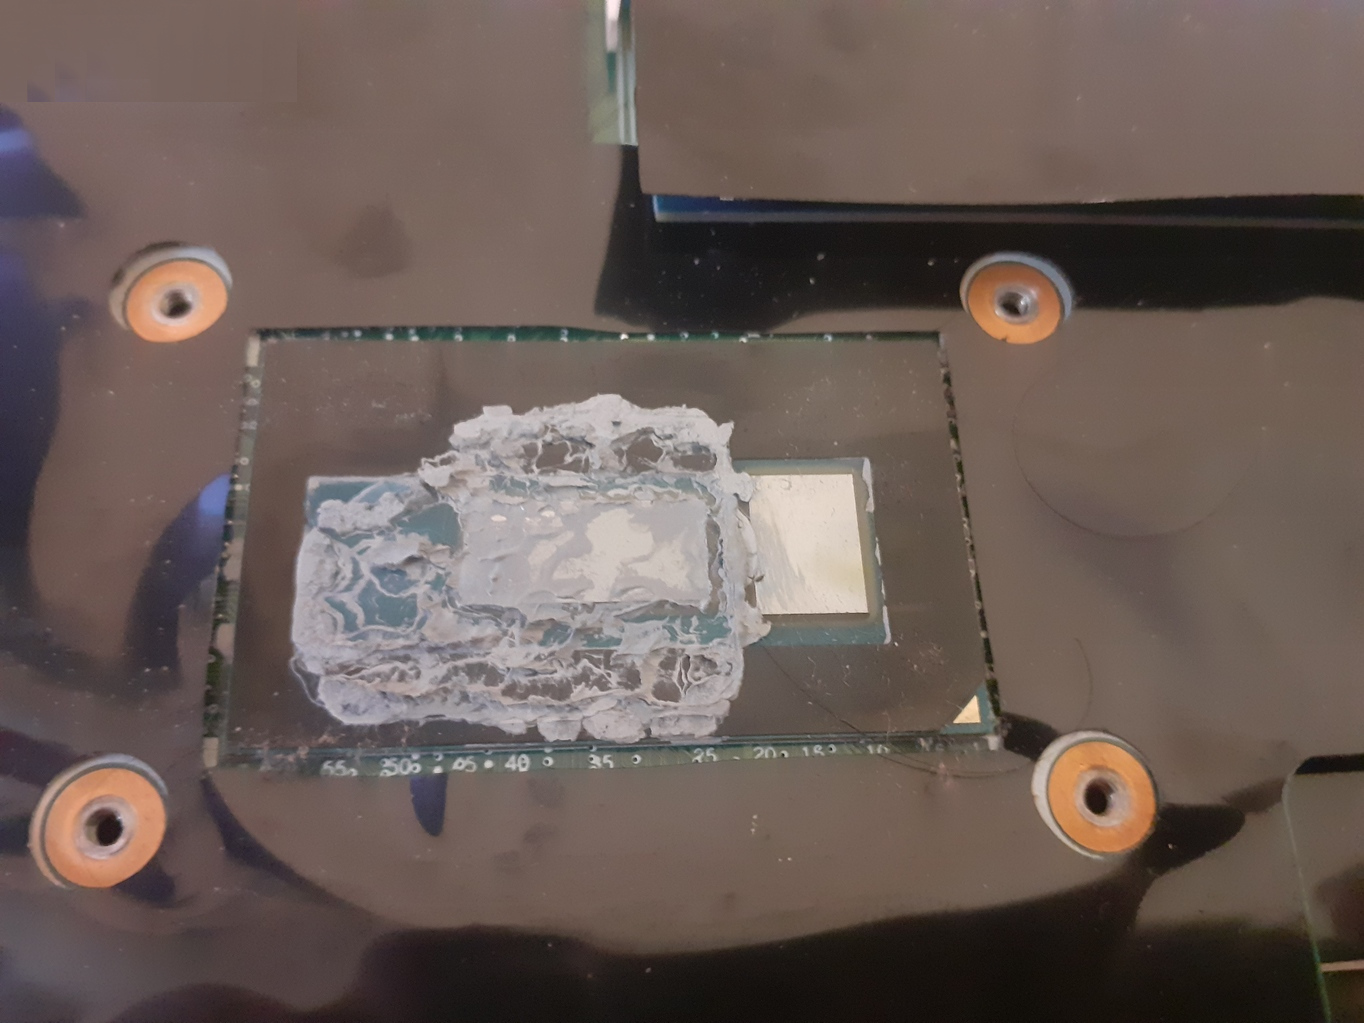
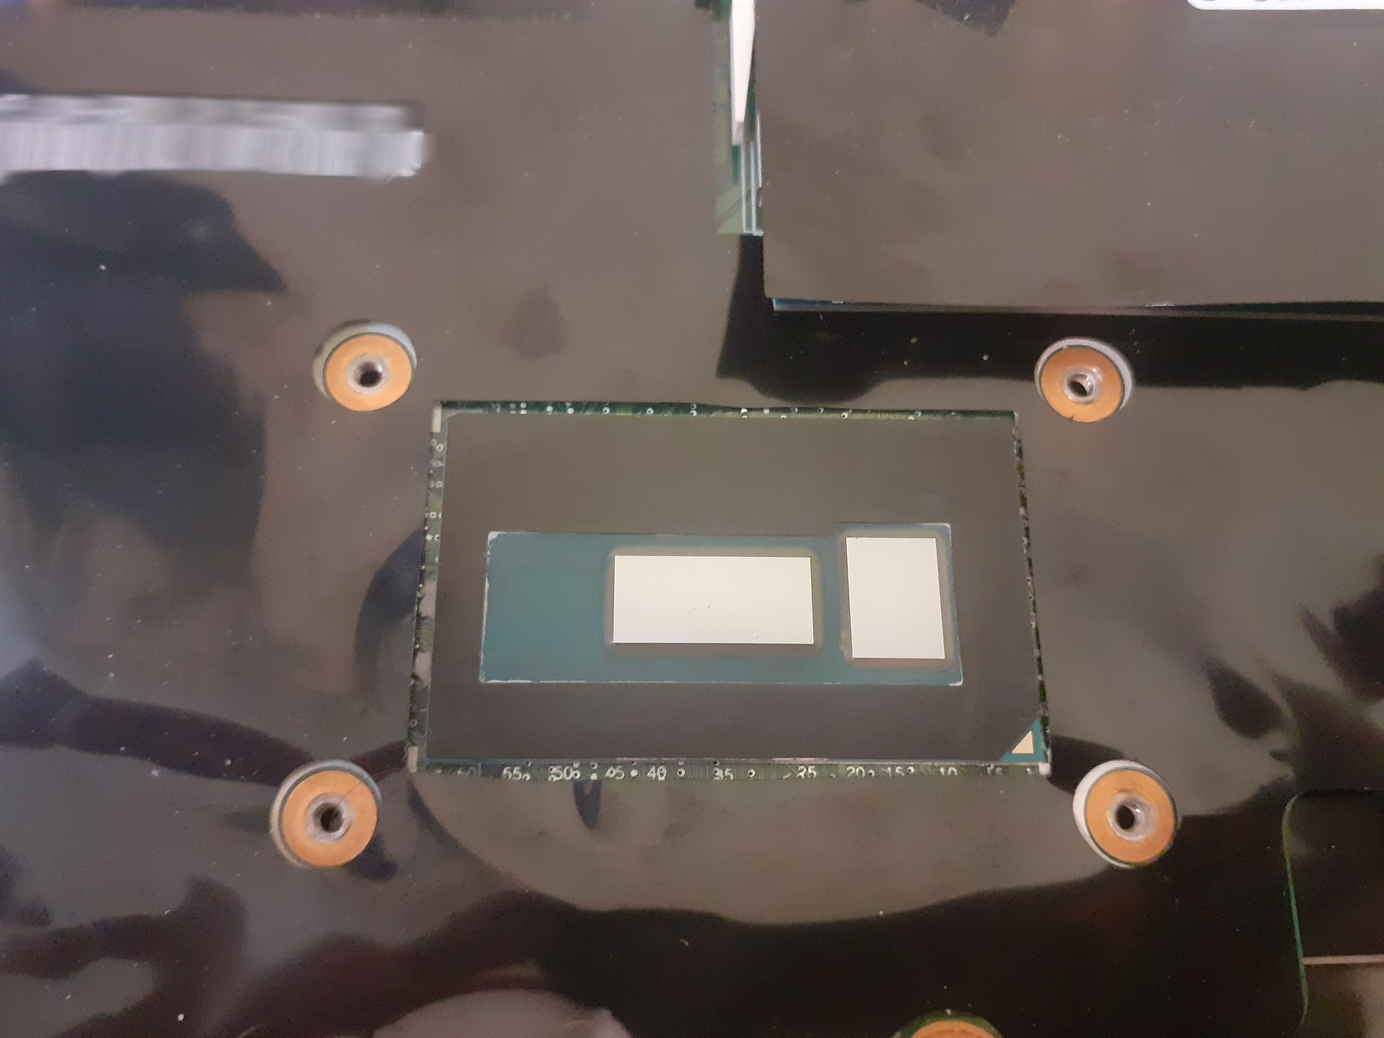
Then I cleaned the old paste using a piece of fabric and an antiseptic alcohol
spray (a relic from the reign of COVID-19 😩)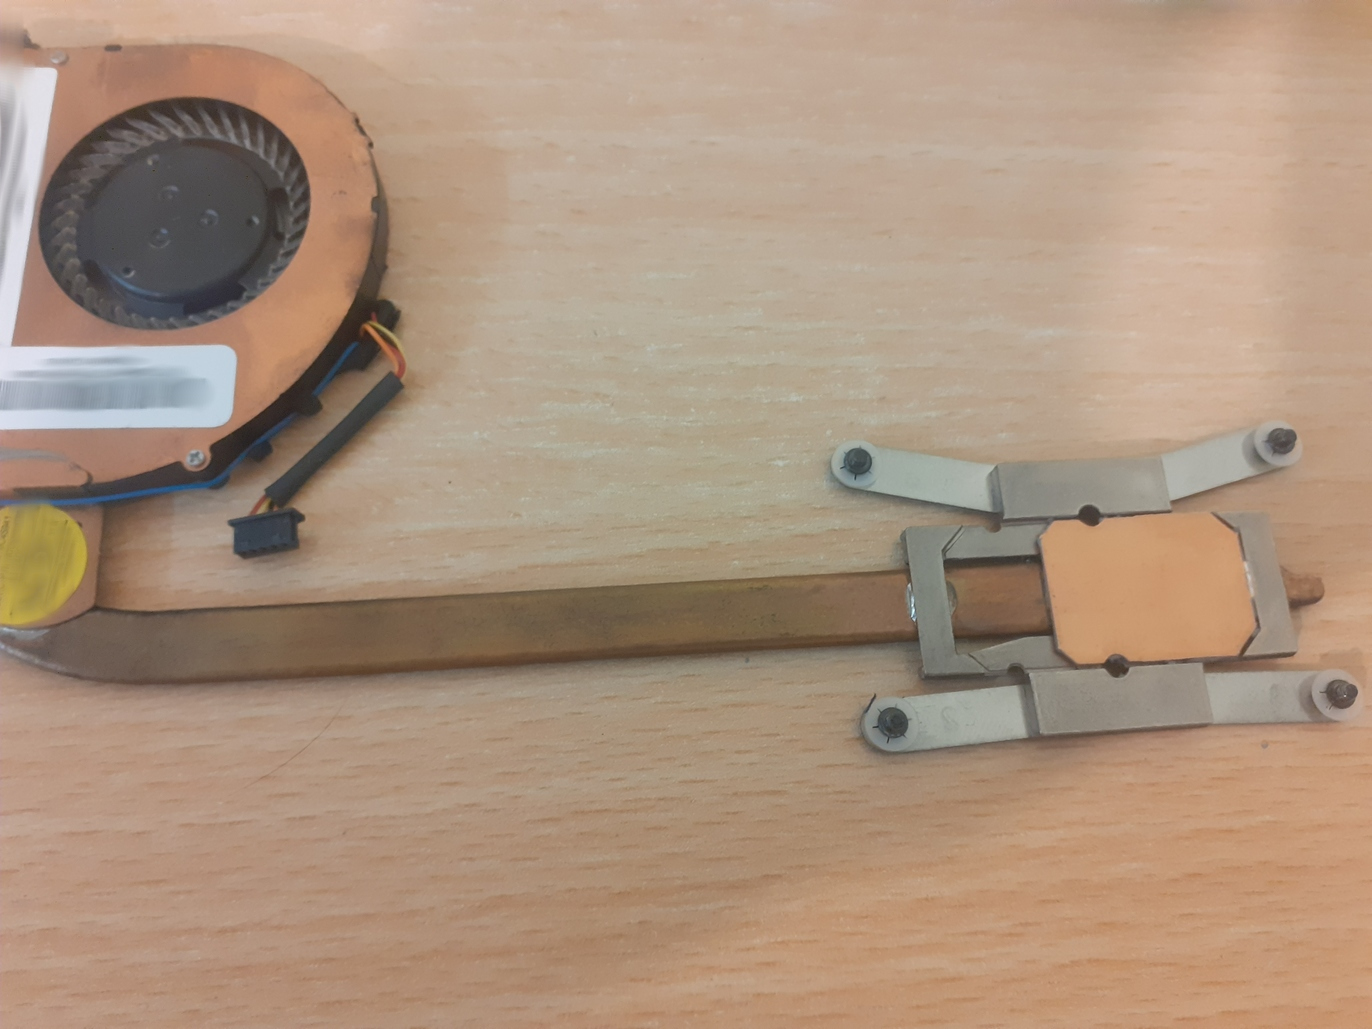
Finally, I applied some paste in linear geometry. There was some excess paste on
the tip of the Z5 syringe so I put it around the line. The right die is not
thermally
stressed but I also applied some on it anyway.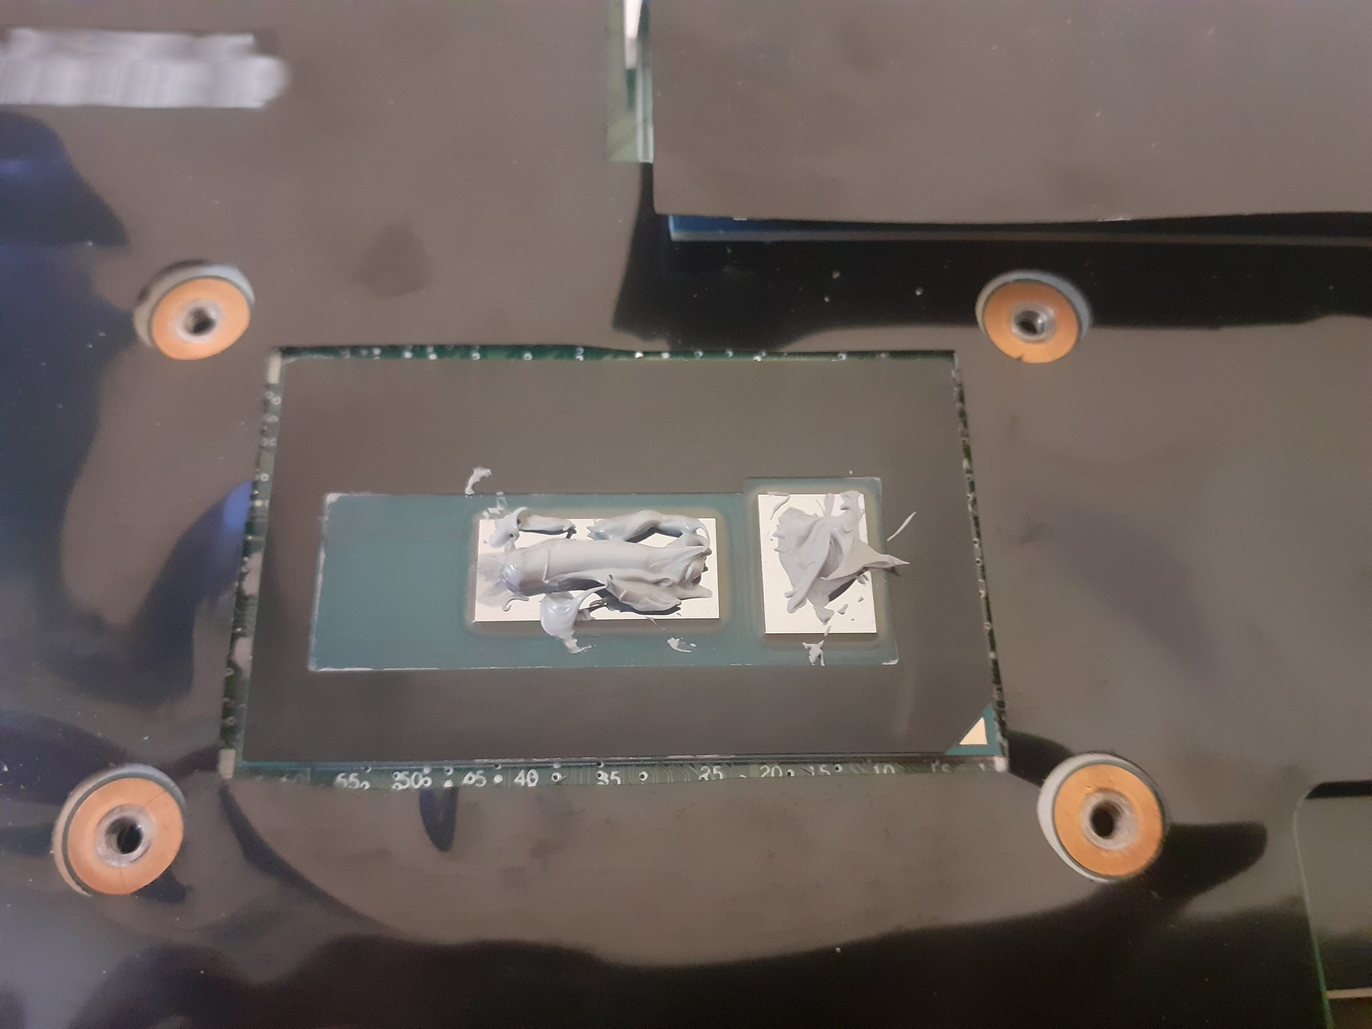
I put the heatsink back, slid it back and forth a bit so the paste would expand all over the die, then fixed the screws.
Stress testing
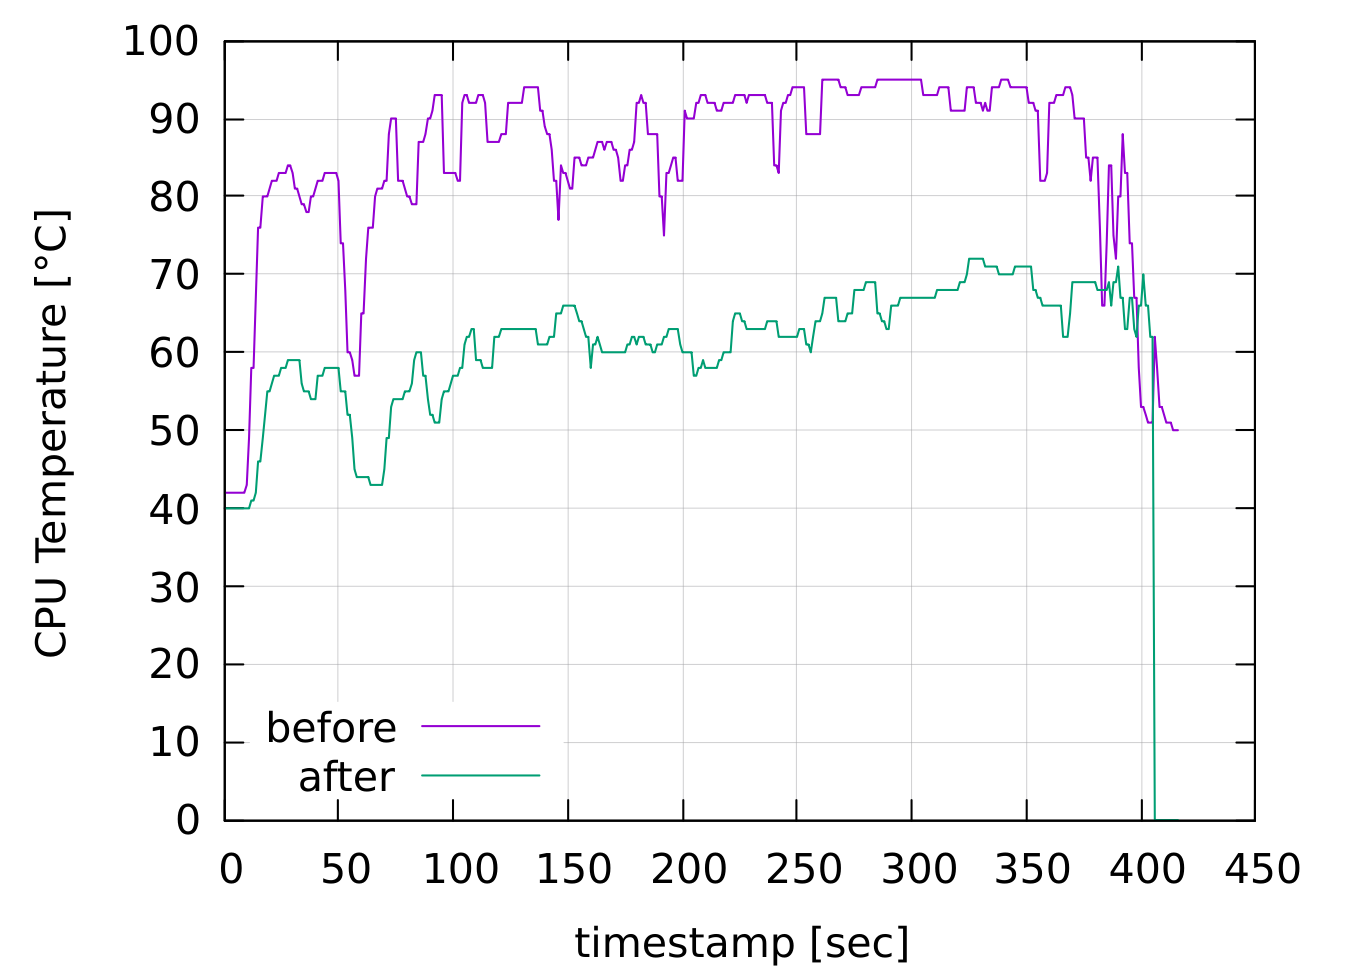
To test whether the procedure was done properly, I benchmarked the CPU using
geekbench6 to put it under stress and recorded die temperatures before and
after applying the paste.
Here is the fish-shell snippet to do this:
| |
(and the same for after.csv)
Here is how I calculated the average temperature of core0:
awk '{ total += $2 } END { print total/(NR*1000) }' before.csv
which resulted in:
before: 85.5062 °C, after: 61.0385 °C
So a 24.46 °C drop, huh? Not bad 😀
Plotting CPU die temperatures
Then I plotted the temperature graphs of CPU die under geekbench6 load using
feedgnuplot:
| |
Geekbench scores improved too:
Before: 1058 Single-Core Score, 1915 Multi-Core Score
After : 1075 Single-Core Score, 2027 Multi-Core Score
Conclusion
I’m happy with the results and wish I’d done it sooner.